Filtering Profile Aggregates
Filtering Profile Aggregates help answer questions such as:
- Which functions regressed the p95 of click responsiveness between versions v1 and v2 of my app?
- Which functions are blocking keypress responsiveness on mobile devices in the last release?
- Which functions regressed my “dashboard_render_time” custom metric on the
/dashboardpage?
Required fields
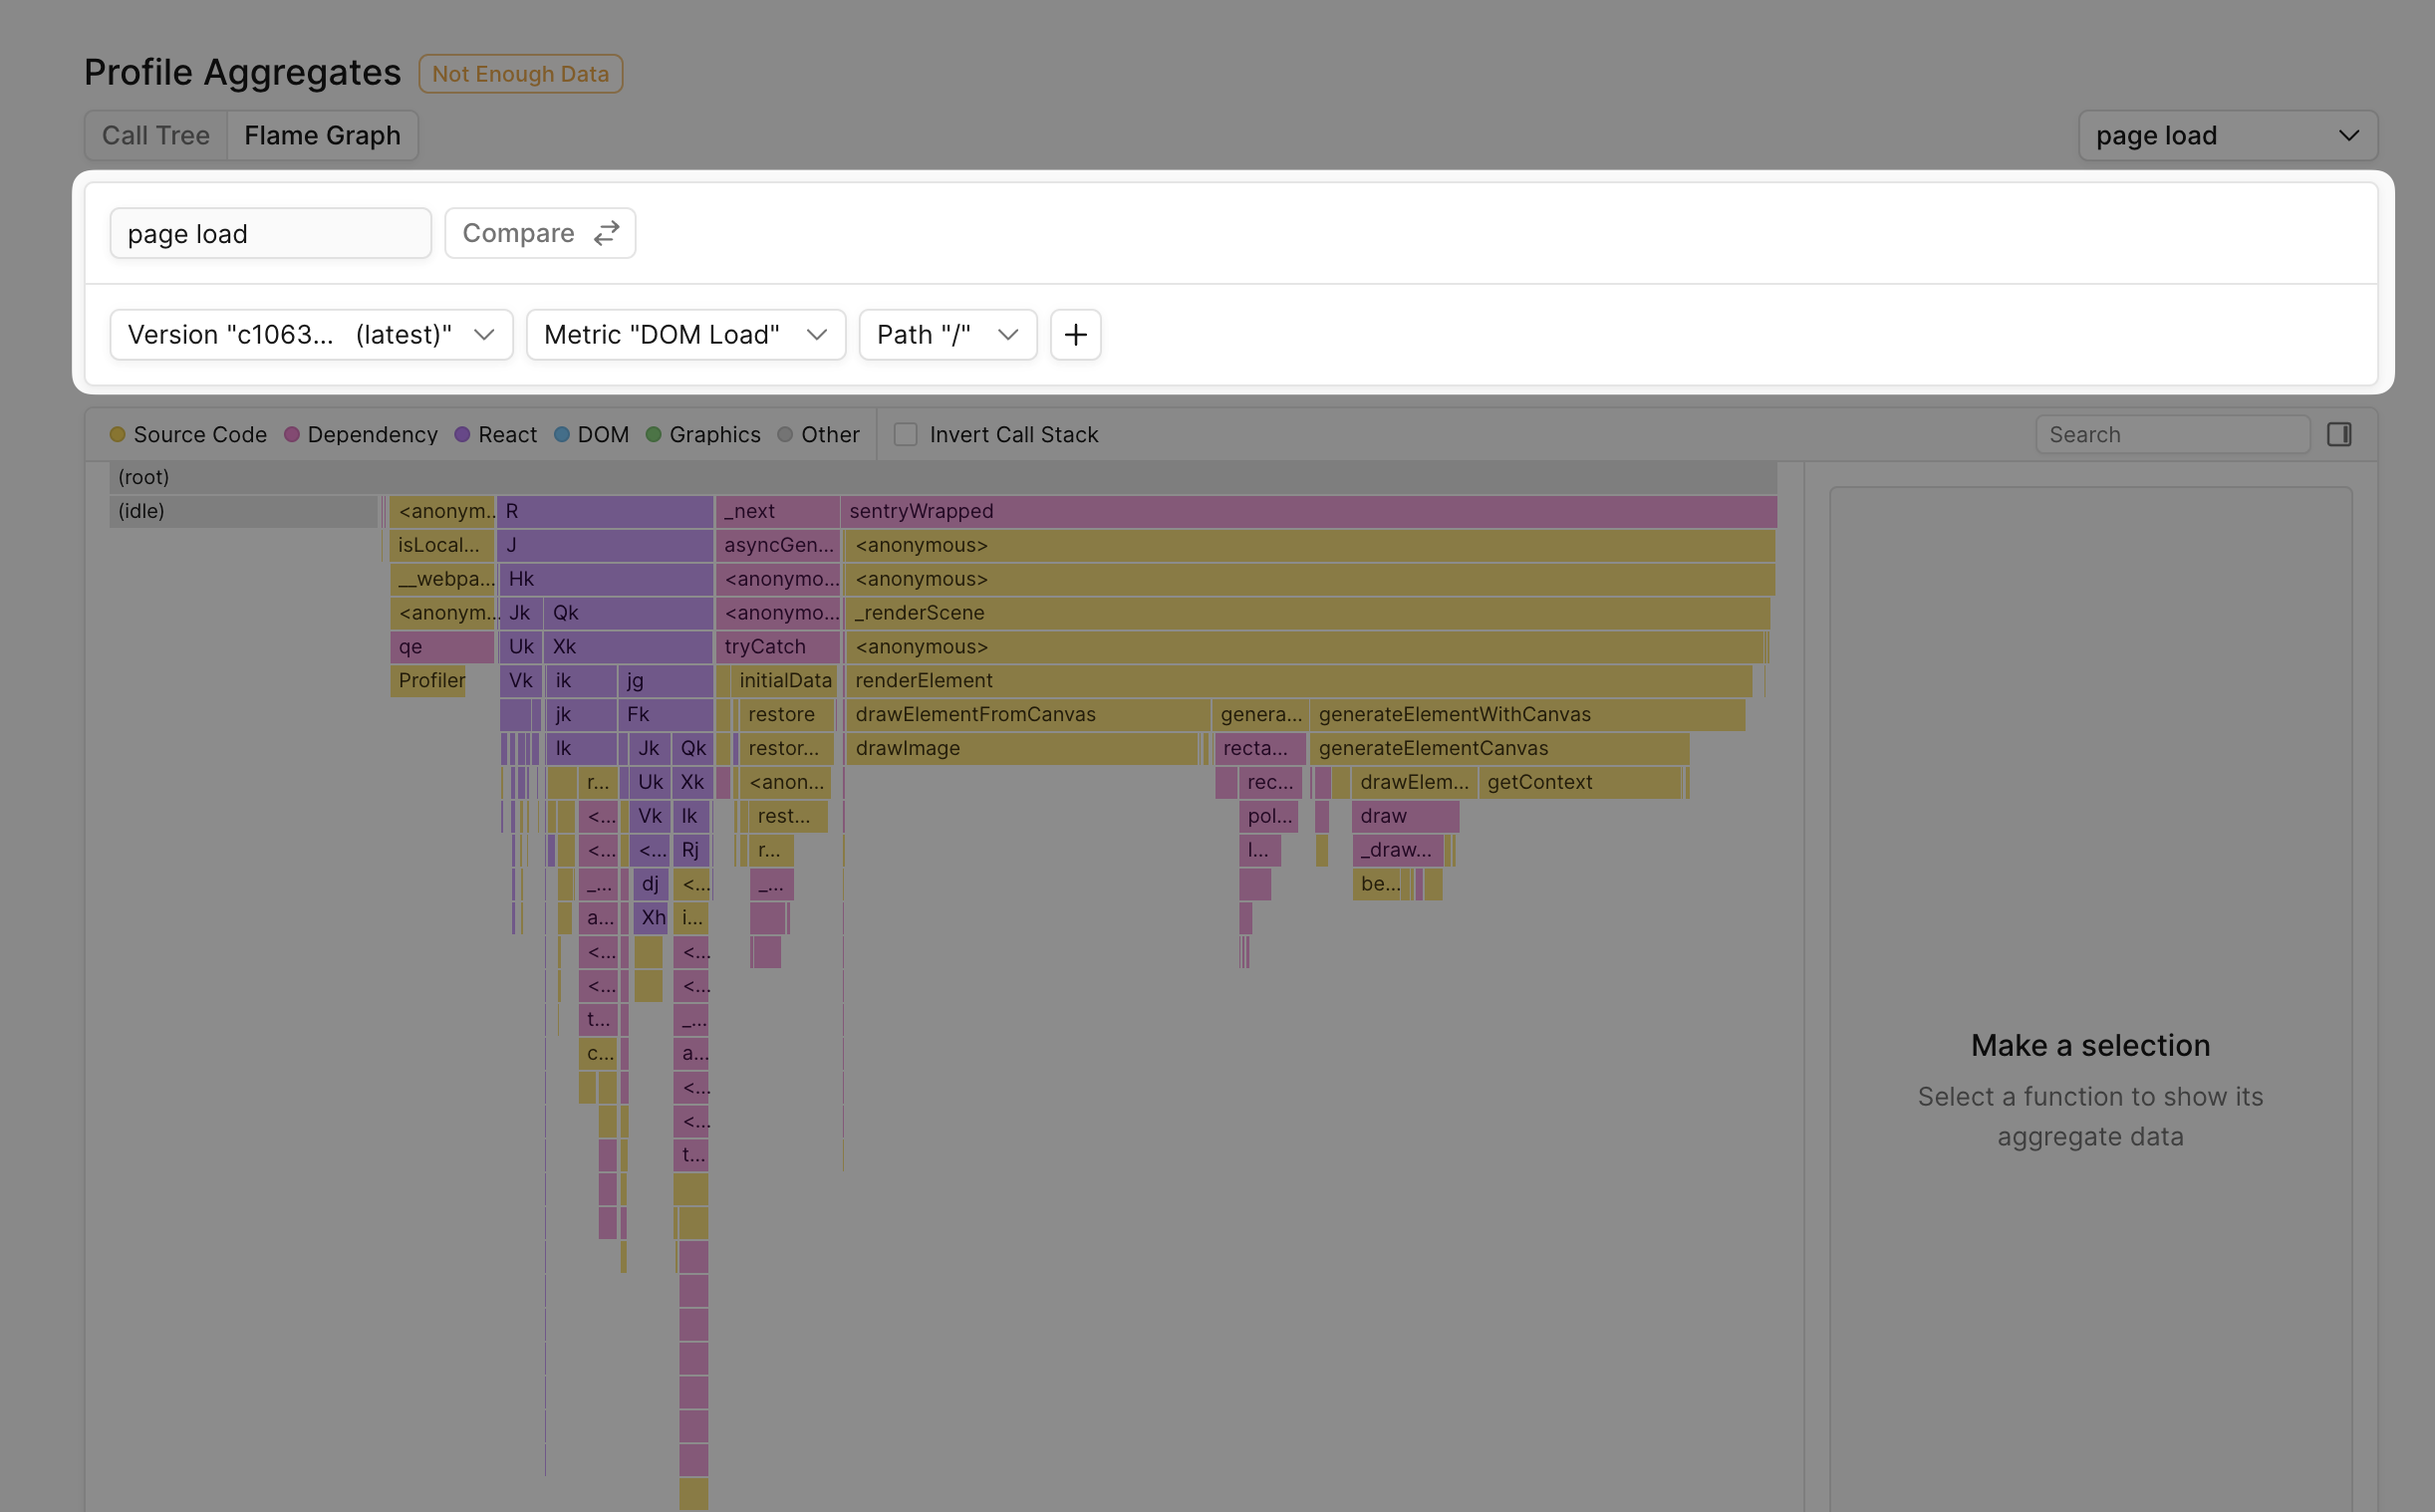
Palette requires filtering metrics by the following fields:
| Field | Description | Values |
|---|---|---|
| Version | The version of your app | Specific version (e.g., v1.2.3), latest (most recent version), or last N (e.g., last 3 for the 3 most recent versions) |
| Metric | The profile samples taken during this metric | Click to Paint, Keydown to Paint, Mousemove to Paint, Scroll to Paint, DOMContentLoaded, load, markers (custom metrics) |
| Path | The page that profiles were collected from |
Optional fields
The following fields are optional:
| Field | Description | Values |
|---|---|---|
| Tag | The tag name and value set by tag | |
| Device | The device type of the session | Mobile, Desktop, Tablet |
| CPU Cores | The number of CPU cores of the device | |
| Memory | The amount of memory (GB) of the device | |
| Metric Duration | The duration in ms of the markers to aggregate against. Duration requires operators to filter values: >, <, =, >=, <= | |
| Region | The region code | US, GB, FR, and more |
| Time Range | The time range of the profile samples. The range can either be relative to the current time or absolute. |
Examples of Aggregate Filters
Which functions are blocking click interactions on the homepage in the latest release?
| Field | Value |
|---|---|
| Version | latest |
| Event | Click to Paint |
| Path | /home |
Which functions are blocking keypress responsiveness that took longer than 1s on mobile devices in the last release?
| Field | Value |
|---|---|
| Version | v1 |
| Event | Keydown to Paint |
| Path | /home |
| Device | mobile |
| Duration | 1000ms |
Which functions regressed my dashboard_render_time custom metric on the /dashboard page?
| Field | Value |
|---|---|
| Version | v1 |
| Event | dashboard_render_time |
| Path | /dashboard |
FAQs
What are (other) stacks and why am I seeing them?
A sample is marked as (other) if there is no JavaScript running when the sample was taken. During these periods, non-JavaScript browser work, such as GC, Layout, and Paint, is likely happening.